Annual Report 2023-24
Overview
The Telecommunications Industry Ombudsman received a total of 56,718 complaints from consumers in the 2023-24 financial year, of which 88.3 per cent were made by residential consumers, and 11.7 per cent were made by small businesses. Read the 2023–24 Annual Report to learn more.
Message from the Ombudsman
"The last 12 months have been important and productive for our organisation, working to drive industry change and support consumers and members to reach fair and reasonable outcomes. Entering my second year in the role, I am inspired by our important work and committed to enhancing the critical role the TIO plays in a rapidly changing landscape.
Telecommunication services are essential services, as important to our quality of life and health and wellbeing as the electricity and water in our homes."

Annual report highlights
Although the total number of complaints decreased by 14.6 per cent compared to the previous financial year, the nature of the complaints indicates ongoing consumer frustration with telcos.
In 2023-24, the main issues facing phone and internet consumers were:
- No or delayed action by a provider: 35,748 complaints
- Service and equipment fees: 19,178 complaints
- No phone or internet service: 6,730 complaints
Mobile services were the most complained about service type in 2023-24 for the third year in a row. Complaints about mobile services accounted for 43.5 per cent of all complaints this year. However, the total volume of mobile complaints decreased by 22.1 per cent from 31,633 in 2022-23 to 24,655 in 2023-24.
Complaints involving network issues made up 44.2 per cent of our complaints, an increase from 39.9 per cent in 2022–23. The TIO received 1,373 complaints related to financial hardship, a 20.4 per cent decrease from the previous year.
Complaints by state
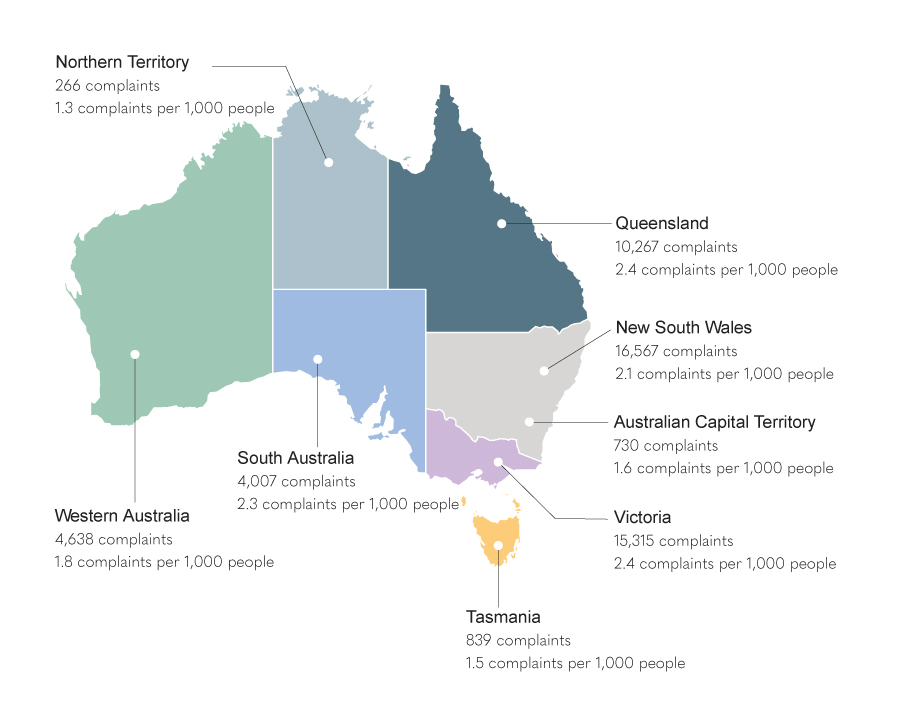
Complaints across all states decreased compared to 2023, with the most significant drop occurring in Tasmania.
Most complaints came from New South Wales, followed by Victoria and Queensland. But when adjusted for population, Victoria leads with 2.4 complaints per 1,000 people, compared to 2.1 in New South Wales.

Our case studies
This report contains a series of case studies from the past year. You can find more information about each case study on the pages listed below.
Data and complaints terminology
Complaint issues and keywords
Help with data navigation
To view more data in detail or to view specific data, click on the 'Select Filters' button ![]() on the top right corner of the dashboard. Click on the drop-down selection to select your desired data fields. Once you're done, click on the 'Clear Selected Filters' to remove all selected filters.
on the top right corner of the dashboard. Click on the drop-down selection to select your desired data fields. Once you're done, click on the 'Clear Selected Filters' to remove all selected filters.
To open a report visual in focus mode, hover over the visual and select the Focus mode icon  .
.
Questions?
For more information, email mediaenquiries@tio.com.au
